
Energy demand management sits at the center of effective energy strategy in 2025–2026, when pricing is shaped by shifting supply and demand, policy signals, and infrastructure constraints. Decision-makers face continued volatility across fuels and power markets, so controlling how and when facilities use energy becomes as important as the contract price itself. Treating demand as a managed asset allows organizations to steady budgets, protect margins, and support emissions goals without sacrificing operational performance.
For senior leaders, the stakes go beyond monthly utility bills. Predictable energy costs support more accurate forecasting, smoother budget cycles across multiple facilities, and a stronger story around risk management and sustainability performance. Clear metrics tied to demand management and procurement results give executives what they need to brief finance committees and demonstrate strategic leadership on operational efficiency.
This article delivers a concise analysis of the leading price drivers and near-term market forecasts, with a focus on their operational impact for academic, commercial, and industrial facilities. Discover how energy demand management, thoughtful procurement design, and smart program participation combine to help reduce peak charges, drive down overall consumption, and cushion organizations from unexpected market volatility. Use a practical ROI framework that links actions like load shifting or demand response participation to clear financial benefits and payback periods that align with board expectations.
What to expect from the 2026 market
Energy pricing for the remainder of 2025 into 2026 reflects a widening gap between wholesale market movements and the retail rates paid by institutional and industrial buyers. Wholesale prices respond quickly to fuel costs, weather, and system constraints, while retail tariffs and contract structures pass these changes through over longer periods and often with added non-energy charges. Regional differences in resource mix, congestion, and capacity costs further compound the challenge for multi-site organizations.
Fuel price volatility remains a primary driver, with natural gas, coal, and oil all influencing the marginal cost of power and the shape of hourly price curves. Grid investments and transmission constraints add another layer, increasing wholesale price dispersion between regions and even within the same ISO or RTO. Policy and regulatory signals around decarbonization, reliability standards, and capacity markets continue to reshape the generation mix, which affects both average prices and the severity of peak events.
Energy demand management becomes a practical way to treat volatility as a controllable variable rather than a fixed external risk in this environment. Demand-side actions, from peak shaving to flexible load scheduling, can work alongside hedging and thoughtful procurement structures to soften exposure to price spikes. Institutions that coordinate demand management with their supply strategy gain more predictable budgets, better alignment with sustainability commitments, and a clearer story for boards on how energy decisions support long-term financial stability.
Energy price outlook 2026
Wholesale electricity prices are forecast to continue their upward trend in late 2025 and early 2026, with the U.S. Energy Information Administration projecting a load-weighted average of $47 per megawatt-hour (MWh) for 2025—23% higher than in 2024—and rising further to $51/MWh in 2026. The most pronounced increases are expected in regions like Texas, where new data centers and high commercial demand are driving spikes, particularly during summer peak periods.
Retail rates tend to respond more slowly because utility tariffs are adjusted on a regulatory cycle, but end users can expect at least modest increases in retail costs as higher wholesale prices and infrastructure costs are passed through.
Regional nuances and uncertainty
Significant variation exists across regions. Parts of the Northwest and Texas may see some relief due to improved hydropower output and incremental growth in renewables, but most regions face steady or sharply rising pricing due to increased demand and transmission bottlenecks. Retail rates in deregulated or high-growth regions respond more directly to these drivers, while states with more regulatory oversight may see a lag in price impacts. Energy demand management allows organizations to limit exposure where regional volatility and spikes could otherwise impact total spend.
Drivers to watch
Natural gas prices continue to shape the wholesale market outlook. An expected jump in natural gas to nearly $4/MMBtu in 2026, largely tied to increased LNG exports and flat domestic production, will put pressure on power prices. Commercial and industrial demand continues to surge, led by growth in sectors such as logistics, data centers, and advanced manufacturing. These trends are most pronounced in the South Central and Western regions and are pushing capacity markets—and wholesale prices—higher.
Electrification across vehicle fleets and building systems adds to peak load and stretches grid resources, increasing the importance of deploying energy demand management to reduce peak charges and manage risk. Regional differences underscore the importance of local market analysis and flexible procurement planning.
Visualizing the energy market
A regional heat map or dual-axis chart comparing expected wholesale and retail price trajectories broken out by region provides a useful tool for spotting both risk and opportunity in the year ahead. Matching energy demand management strategies to these projected changes supports better budgeting, more effective procurement, and measurable cost control through 2026.

Energy demand management as the repeatable ROI engine
Energy demand management serves as the core tool for hedging against price volatility and achieving reliable budget outcomes. Organizations that treat demand as an active variable rather than a fixed input gain control over costs and align operations with financial targets. This approach delivers repeatable results through targeted actions that reduce exposure to peaks and optimize overall consumption.
Shifting non-critical operations to off-peak periods stands out as one of the simplest ways to lower bills. Facilities can cut peak demand by 10 to 20 percent through basic adjustments like rescheduling HVAC runs or batching lighting loads, which often translates to 5 to 15 percent savings on total energy charges. Energy demand management makes these changes systematic, using data to identify the best times and track reductions in real time.
Facility efficiency initiatives
Intelligent controls and HVAC optimization form the foundation of long-term gains. Process energy audits reveal opportunities to lower energy intensity, such as upgrading to variable-speed motors or smart thermostats, which can reduce demand charges by up to 25 percent in high-use buildings. Energy demand management ties these upgrades to measurable drops in usage per square foot, creating a clear path to sustained savings across academic and industrial sites.
On-site generation and storage
Pilots with batteries or small-scale renewables prove effective when paired with time-of-use rates. These systems capture capacity payments from utilities and enable participation in demand response, potentially offsetting 20 to 30 percent of peak costs through arbitrage between low and high-price hours. Energy demand management integrates onsite assets into daily operations, maximizing their role in smoothing load profiles and supporting grid stability.
Demand response participation
Programs from regional ISOs offer revenue streams for curtailing usage on short notice, with lead times as little as 30 minutes in some markets. Participants earn payments averaging $50 to $100 per kW reduced, plus avoided charges, but success depends on clear governance to avoid operational disruptions. Energy demand management provides the monitoring and automation needed to enroll reliably and measure payouts against targets.
Procurement flexibility
Staged hedging and supplier diversification allow capture of low-price windows without overcommitting. Split-market strategies, such as fixed rates for baseload and indexed for flexible loads, limit upside risk while preserving access to savings. Energy demand management complements this by aligning load patterns with contract terms, turning procurement into a dynamic tool for cost control.
Building the ROI framework
Payback periods for energy demand management projects typically range from 12 to 18 months for quick wins like automation, while efficiency retrofits may take 24 to 36 months due to upfront costs. A basic model starts with annual spend reductions of 8 to 15 percent from lower usage, plus 10 to 20 percent cuts in demand charges and DR revenues of $0.05 to $0.10 per kWh shifted. Add avoided spikes, which can save 5 to 10 percent more during volatile events, to build a full picture.
Risk-adjusted scenarios add depth: a base case assumes steady implementation with 10 percent savings; upside includes full DR participation for 15 percent returns; downside factors in partial adoption or market shifts for 5 to 7 percent. This framework helps finance teams project net present value and internal rate of return, often exceeding 20 percent for well-scoped initiatives.
Key indicators and governance
Track facility-level energy use intensity to spot trends, aiming for 5 to 10 percent year-over-year drops. Monitor peak load timing to stay within guardrails and avoid penalties, while logging DR enrollments and payments to validate revenue. Facilities leaders handle day-to-day execution, procurement sets the supply framework, and finance oversees metrics like savings versus budget.
Regular reports to executives, delivered quarterly, highlight progress on these indicators and tie energy demand management to broader goals like emissions cuts and capital efficiency. This structure keeps initiatives accountable and positions energy as a driver of strategic value.
Energy procurement playbook 2026
A resilient procurement strategy for 2026 starts with clarity on how much energy is used, when it is used, and how that spend responds to price movement. Institutions that pair disciplined procurement planning with energy demand management are better positioned to keep costs predictable and support growth and sustainability commitments.
Step 1: Establish a strong baseline
A robust baseline assessment reviews at least three years of interval data, load profiles, and historical price exposure across all sites. This view should separate energy, demand, and non-commodity charges so decision-makers can see which levers matter most for each facility. The same dataset feeds energy demand management, revealing peak windows, flexible loads, and facilities that are candidates for demand response or efficiency projects.
Step 2: Strengthen market intelligence
Effective procurement relies on timely insight into regional price signals, supplier behavior, and regulatory changes that may affect capacity and network charges. Teams should track forward curves, congestion trends, and utility filings, then translate that information into practical guardrails for contracting. Market intelligence also helps identify where energy demand management can work in tandem with tariffs or programs that reward peak reduction and load flexibility.
Step 3: Align risk appetite and financial targets
Clear direction from the board on risk tolerance, cost containment thresholds, and sustainability goals is essential. Procurement leaders should quantify how much spend can remain market-exposed, what level of year-over-year variance is acceptable, and how carbon or renewable targets shape contract choices. Energy demand management supports this discussion by demonstrating how peak control and load shifting can reduce the amount of supply that must be hedged at any given time.
Step 4: Design strategy and sequencing
Hedging strategies should match both budget cycles and operational realities. Many organizations fix a portion of baseload for two to three years while leaving a smaller slice indexed or shorter term to capture favorable dips. Supplier strategy should prioritize diversified portfolios, transparent billing, and performance-based clauses that reward accurate forecasting and service quality. Contract structures should explicitly leave room for energy demand management initiatives, including the ability to participate in demand response, adjust capacity levels, or integrate onsite resources without penalties.
Step 5: Integrate metrics and reporting
A focused KPI set keeps the procurement playbook actionable. Core metrics often include percentage of spend exposed to market volatility, hedge coverage and effectiveness, demand response participation and revenue, and realized ROI from energy demand management projects. A structured reporting cadence works well: monthly market briefings to flag price movements and contract opportunities, quarterly performance reviews that link procurement and EDM results, and an annual risk review that ties outcomes back to board-approved targets. This rhythm gives leadership confidence that procurement decisions are disciplined, data-backed, and aligned with long-term strategy.
Regulatory and sustainability considerations
Regulatory and sustainability expectations are shifting quickly for large energy users in 2026, and procurement decisions sit squarely in that spotlight. Compliance teams must keep pace with evolving rules on renewables integration, emissions disclosure, and grid reliability, while still delivering cost control and predictable budgeting. Procurement strategies that coordinate closely with energy, sustainability, and risk functions will be better positioned to meet these expectations without creating operational friction.
Energy demand management plays a central role in meeting compliance and reporting requirements. Demand-side controls, automated response capabilities, and accurate metering support participation in utility and ISO programs that increasingly favor flexible load and grid-supportive behavior. The same data streams that power energy demand management also improve emissions accounting, allowing organizations to attribute avoided consumption and peak reduction to scope 1 and 2 targets with greater confidence.
From a sustainability perspective, demand management programs provide one of the most direct ways to lower operational emissions intensity while generating financial returns. Load shifting away from high-carbon, high-cost hours, reducing overall kWh consumption, and pairing demand management with renewables procurement all contribute to decarbonization pathways that boards can understand and support. These actions help demonstrate progress against internal climate commitments and external reporting frameworks.
Practical design of any strategy should focus on scale, auditability, and alignment with enterprise risk management. Energy demand management initiatives need clear ownership, documented procedures, and traceable performance records so internal audit and external reviewers can follow the chain from policy to outcome. Procurement contracts, program enrollments, and project approvals should reference the same risk language used in broader enterprise frameworks, tying market exposure, compliance obligations, and sustainability metrics into a single, coherent narrative for executives and board members.
Your practical 90-day plan for getting started
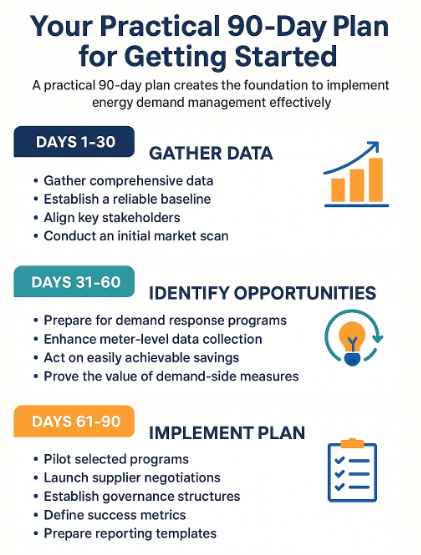
A practical 90-day plan creates the foundation to implement energy demand management effectively. In the first 30 days, focus on gathering comprehensive data, establishing a reliable baseline, aligning key stakeholders, and conducting an initial market scan. These steps provide a clear picture of consumption patterns, load profiles, and potential price risks across facilities.
Days 31 through 60 should target identifying energy demand management opportunities that deliver quick wins, such as preparing for demand response programs and enhancing meter-level data collection. This phase builds momentum by acting on easily achievable savings and proving the value of demand-side measures.
The final 30 days bring piloting of selected programs, launching supplier negotiations, and establishing governance structures. Defining success metrics and preparing reporting templates during this period creates accountability and transparency, supporting ongoing optimization. Deliverables from these 90 days include a formal energy demand management roadmap, a market-briefing memo, and a staged procurement plan with clear ROI estimates.
Ready to lock in predictable energy costs and gain a competitive edge in 2026? Contact Kb3 Advisors today for a complimentary energy spend analysis and custom roadmap. Our energy procurement experts deliver data-driven energy demand management strategies that cut volatility, boost ROI, and align with your growth goals.
Sources
- Short-Term Energy Outlook. eia.gov. Accessed December 2, 2025.
- Forecast wholesale power prices and retail electricity prices rise modestly in 2025. eia.gov. Accessed December 2, 2025.